English { } Deutsch
Understanding built climate neutrality
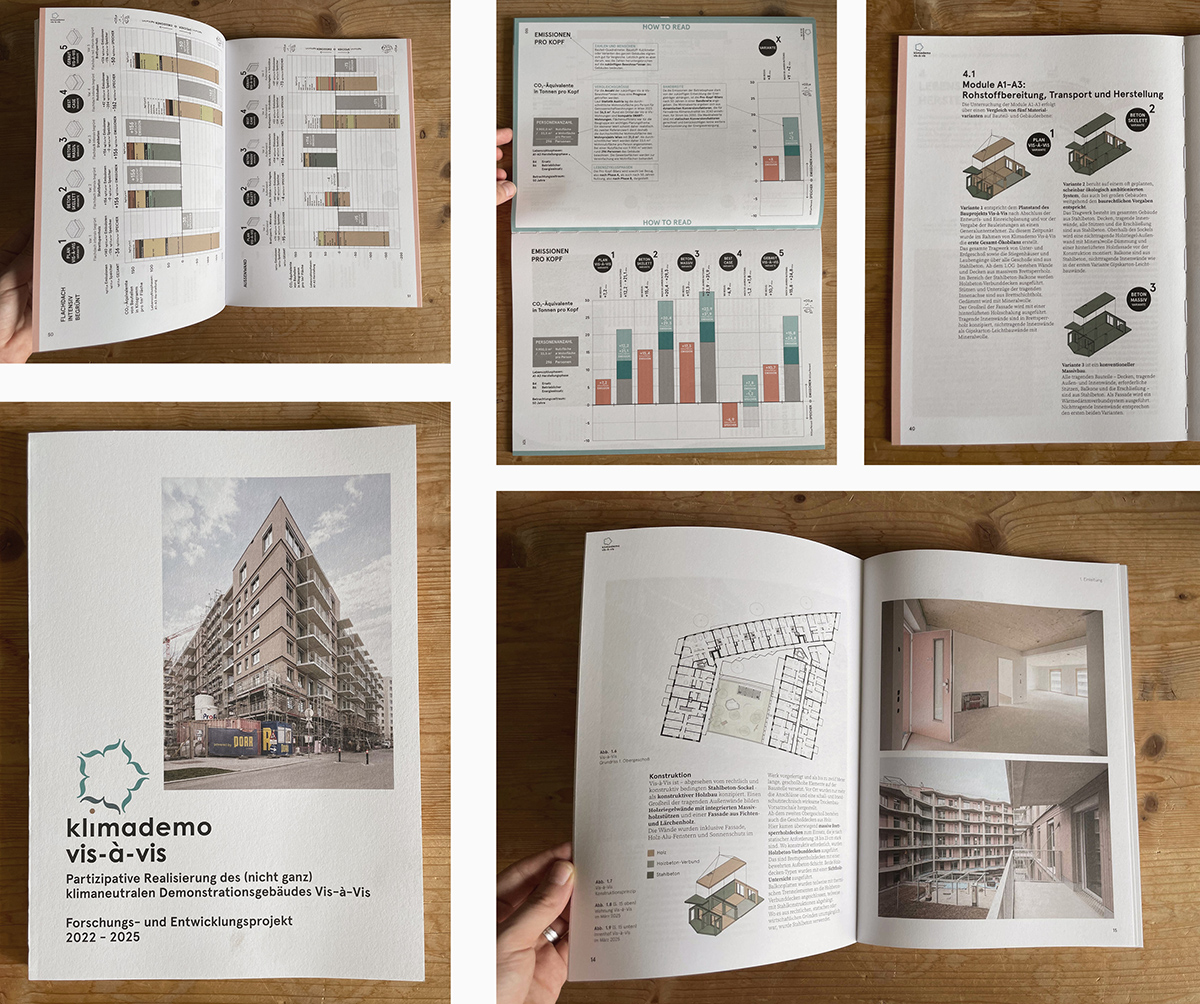
Putting life cycle climate performance in a graph
Learning from Transsolar
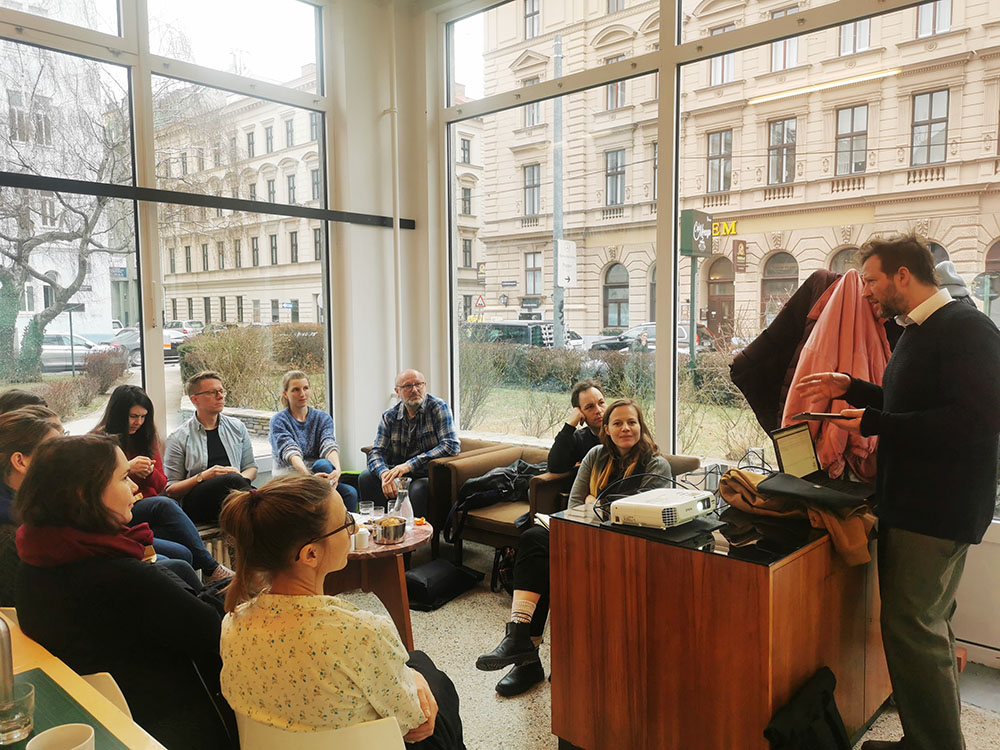
During our excursion in Munich we visited the company Transsolar KlimaEngineering. It was not a best practice example from which you learn by looking at how things were done there, but we certainly learned a lot! We learned like students, from a lecture. Our host Markus Krauß in high speed demystified seemingly complicated concepts around climate neutrality. He explained a clear graph, that in a split second visualizes the performance of a building over time. That is the kind of graphs we want to make as an output of our project, showing the performance of our building.
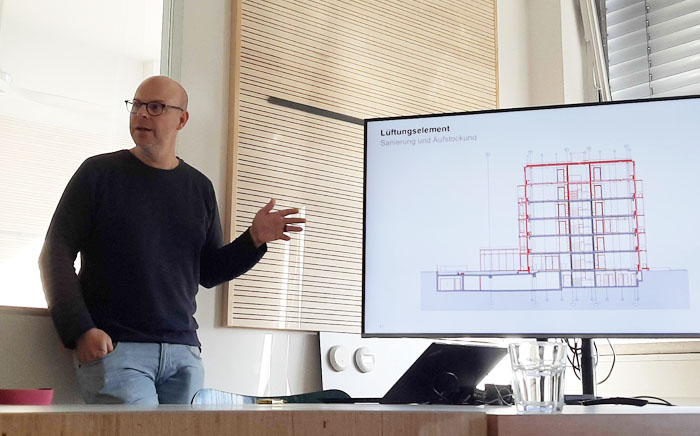
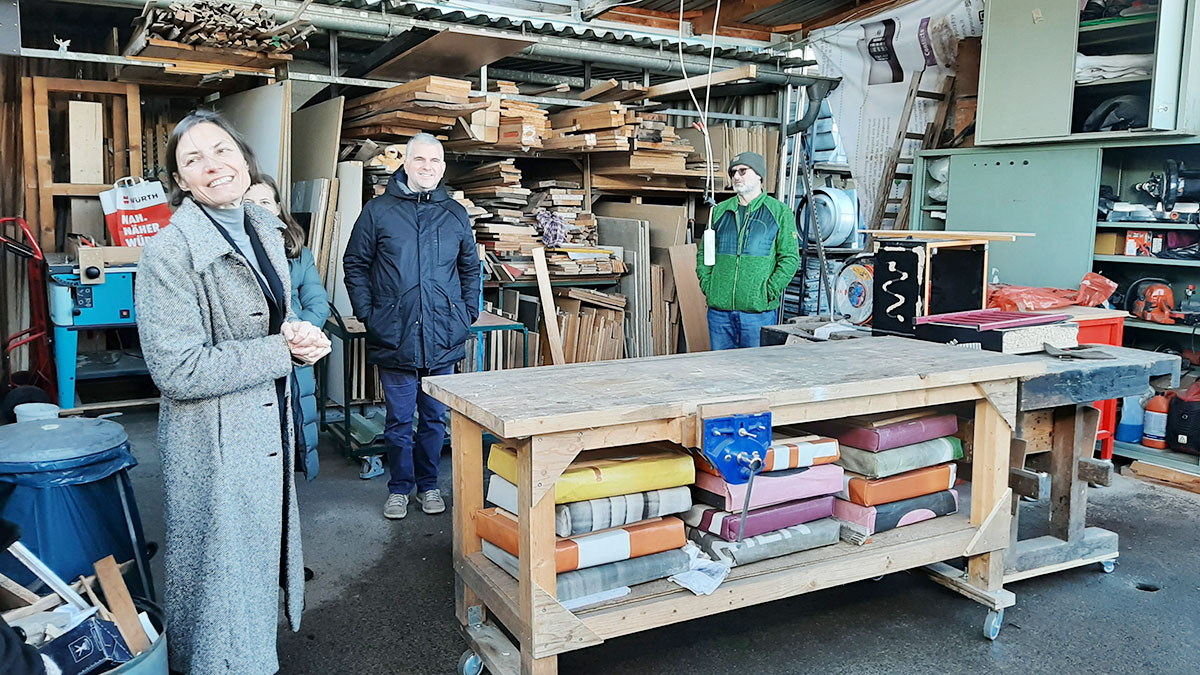
Markus Krauß of Transsolar. Foto: Vis-à-Wien
Visualizing the numbers of the climate burden in a graph
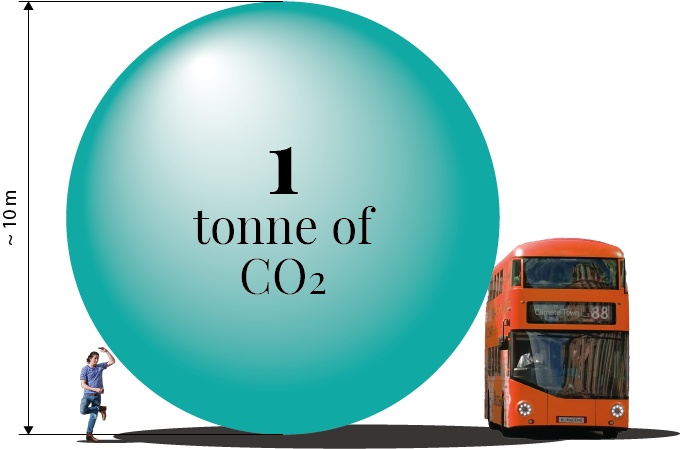
The vertical axis describes the ‘climate burden’ as calculated in tonnes CO₂. Somehow everything is ‘translated’ into this CO₂ equivalent. The general idea is to get to zero – climate neutrality – by making sure that no energy from the outside is needed. That results in a horizontal line in the graph. If the insulation is such that outside energy is still needed, the line rises. In that case the surface below the graph (the number of year × CO₂ output) is the total amount of CO₂ produced. That is what we don’t want, the line has to stay at least horizontal. If the amount of solar panels is such that the building is a net producer of energy, the line goes down. The surface below the axis is the avoided CO₂ production.And we need that, because at the end of the life cycle of the building, the demolishment will cause CO₂. That must have been compensated in the previous years, in order to have a zero sum result. In fact the end of life is not the only point we have to think of. Well before demolition, at some point trucks of building companies come in and bring in a new kitchen, a better heat system, or simply some paint. Renovation uses resources and energy, as in fact does the initial building itself. All of that CO₂ output needs to be compensated.
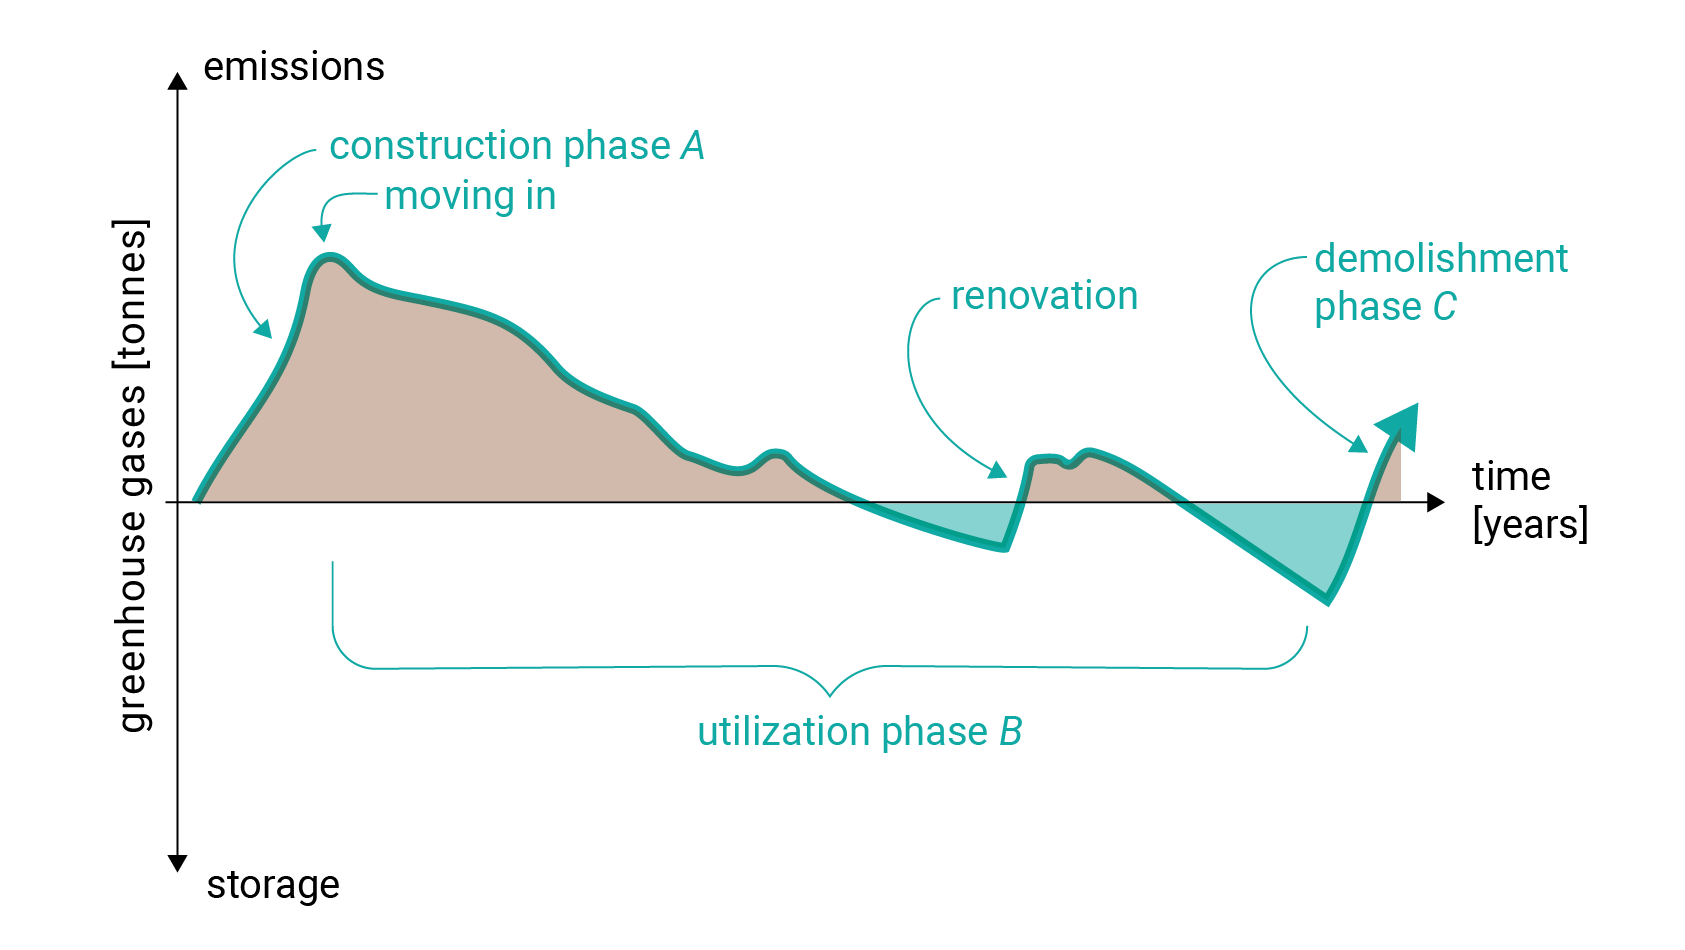
Schematic climate performance of a building during its life cycle. Graphic: Vis-à-Wien
That is where a lot of the confusion around climate neutrality comes from. If you only look at the operational phase, a lot of the costs to the planet are so to say placed outside of brackets of the calculation. We don’t want to trick things with that kind of green-washing. What this means in terms of the visualization in the graph, is that we look at the entire life cycle on the horizontal (time) axis. If you leave out the initial construction phase (as often happens) you forget that the building has a kind of mortgage, or backpack, at the point you move in. Here this is shown in brown.
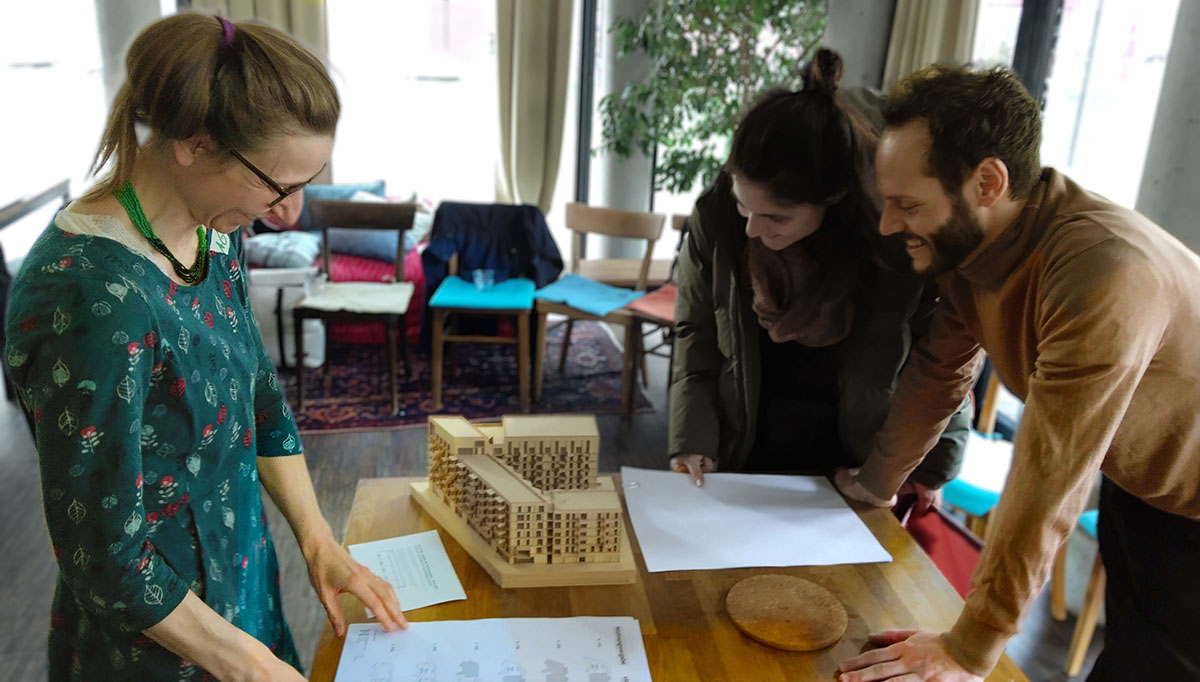
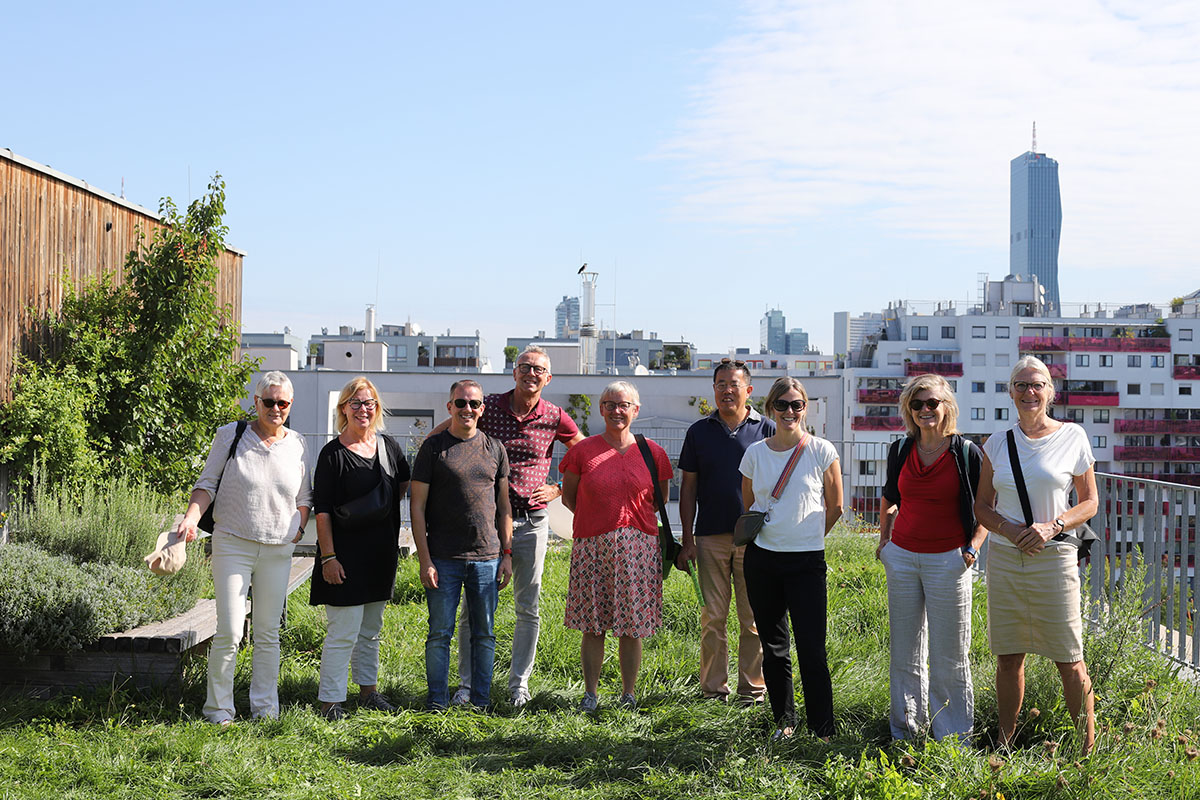
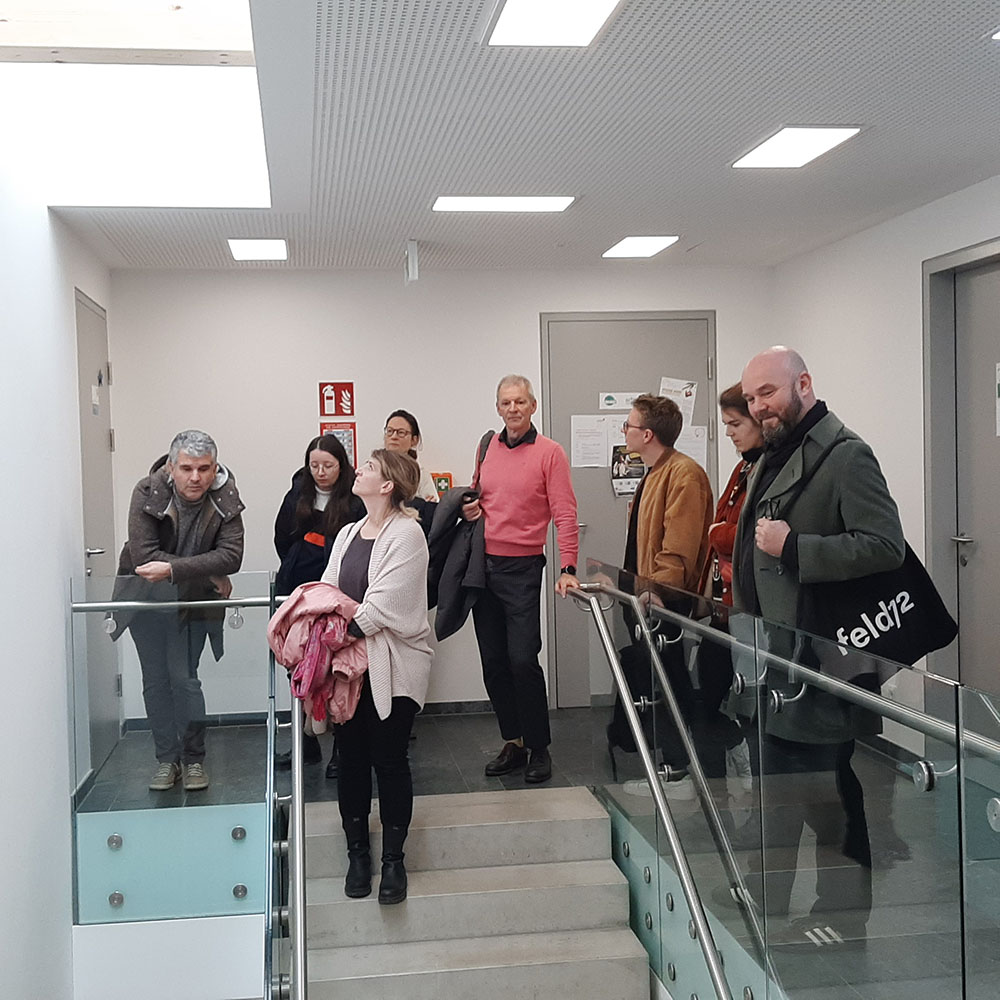
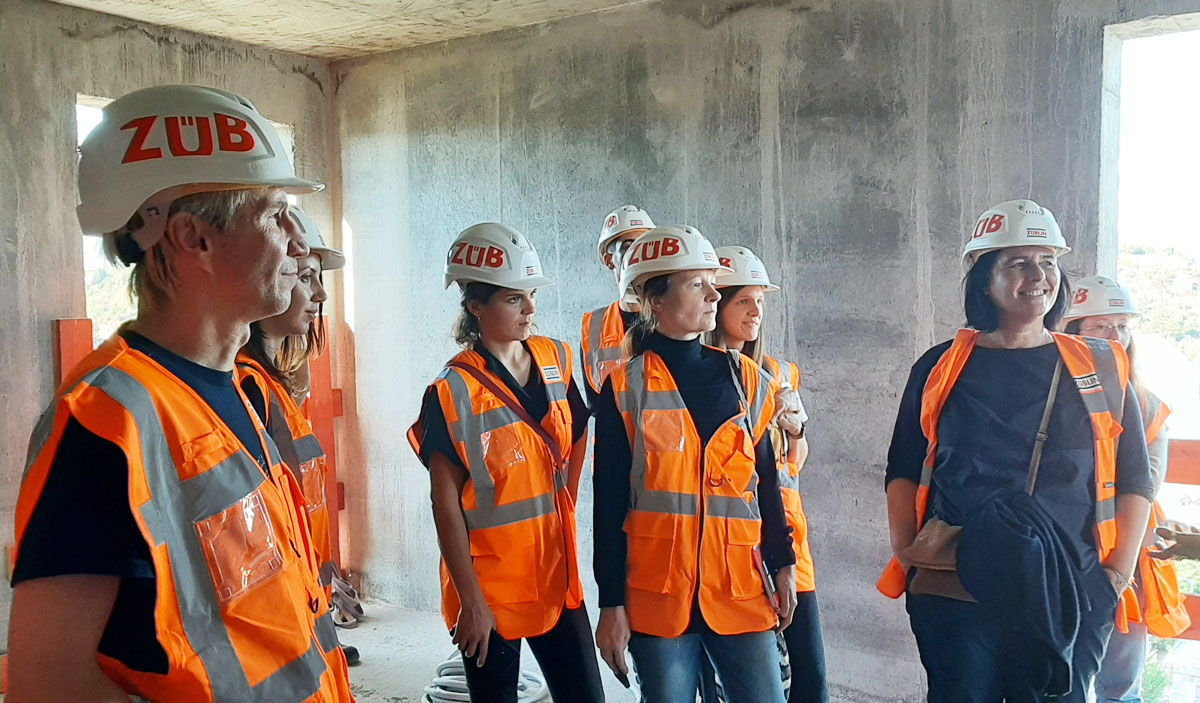
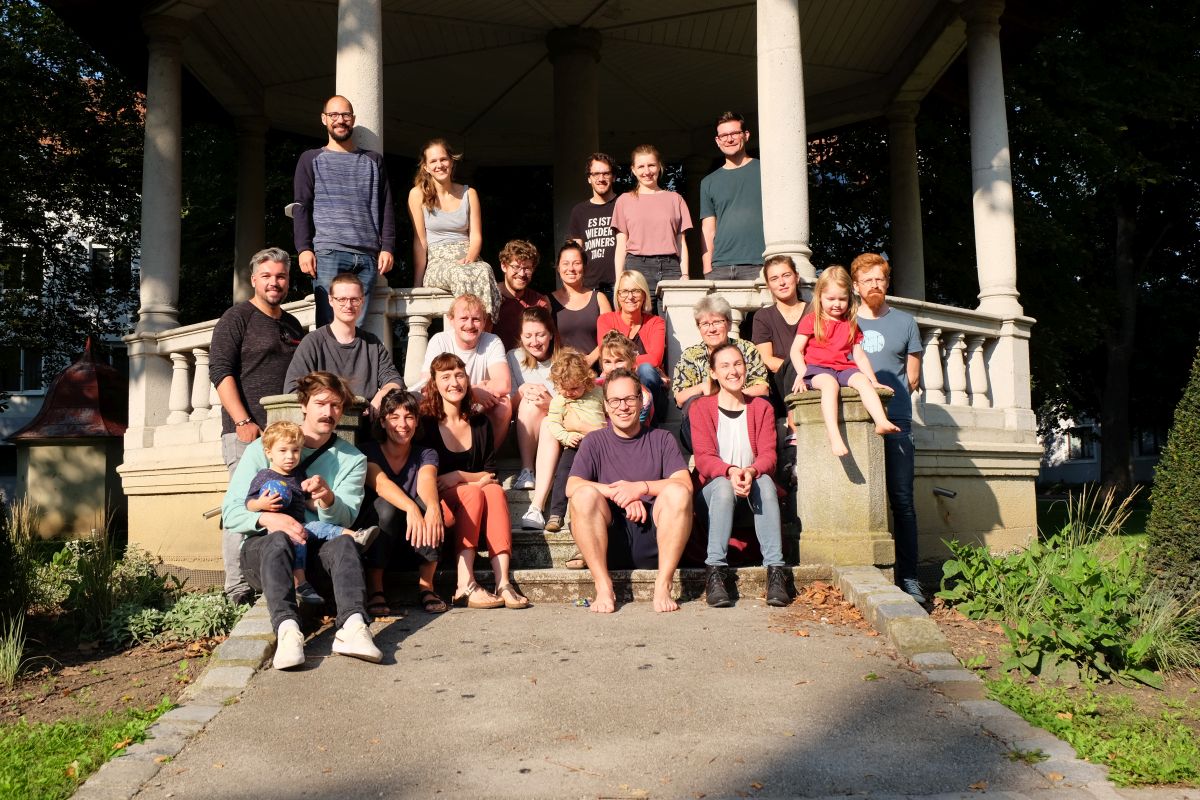
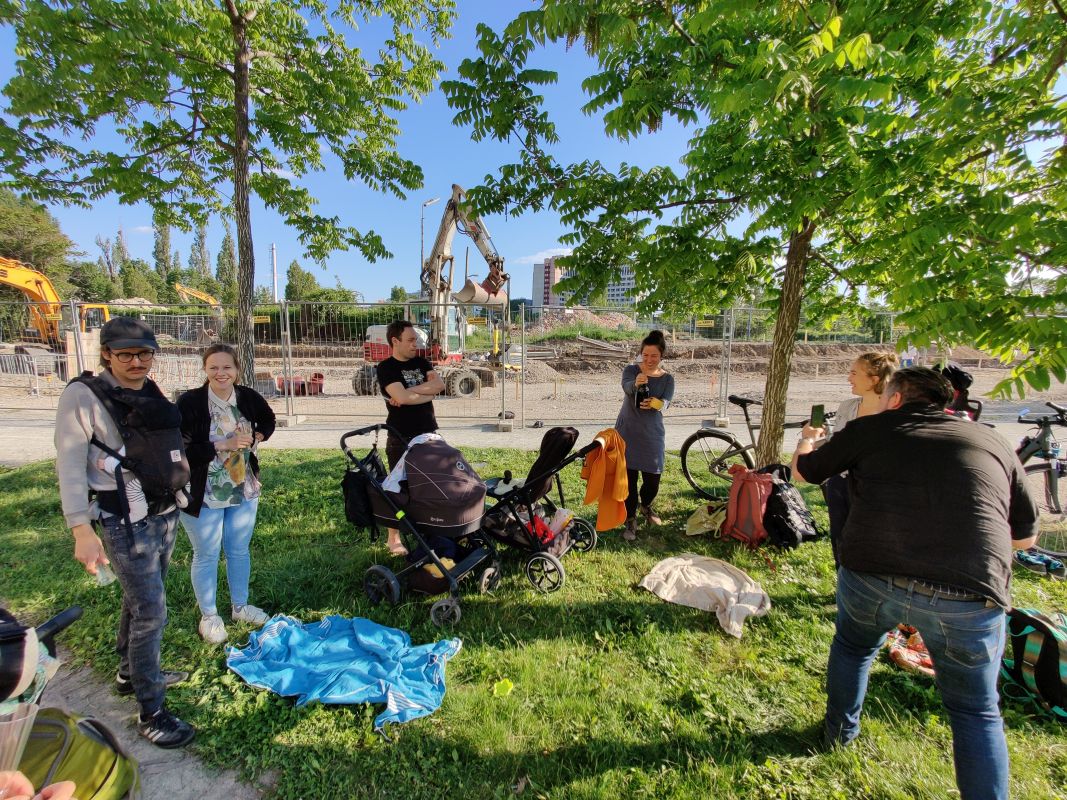
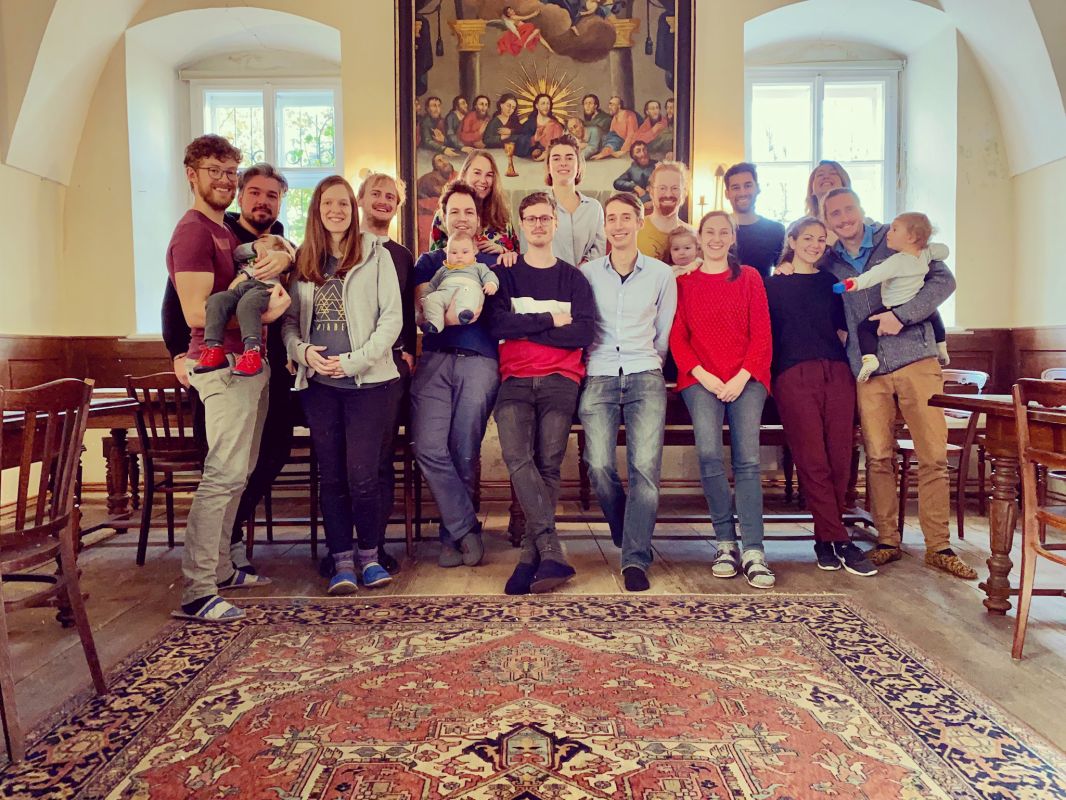
The researchers on tour. Photo: Vis-à-Wien
How can we make the line fall?
As a group we do not want to fool ourselves by calculating until a „0“ comes up. Instead we want to see in all honesty how much is possible and what we can do about it ourselves, within the limits of our budget. That is what we want to get out of this research project. We stress questions like: What is possible in the construction phase, for instance by using materials that do not require much transport? How do extra measures in the construction phase compare to what is saved when the building is in use?
During the lecture of Markus Krauß it was clear that some aspects that impact the graph are outside of what we can influence. The location and orientation of the building for instance, or the quality of the electricity in the net. It makes a difference if that electricity is generated by water force or coal. What we can influence is the optimization of the use of the building and having efficient systems. During the construction phase we try to use wood and other materials with little impact. In the design we look for passive measures that make it possible to catch sun in winter and allow for good cross ventilation in summer. All in all, the idea is to invest right at the start in measures that allow the building to be CO₂ negative in the long run. But, we learned in Munich, we should only look at the first 20 years; a period that can more or less be overseen. Claiming any compensation or solutions beyond that period are a kind of crystal ball projection.
In our evaluations and discussions the things we learned from Transsolar were resonating. For instance the remark that at this point it would be better to not demolish any buildings any more, came back in the ‘list of urgent measures to be taken’ that came up in one of our debates. And mind you, this discussion was on the train, not at the dinner table after some wine.


Professionals and inhabitants alike, we are all aware that the situation is serious and needs to be addressed at all levels. We can’t just sit and wait until the building norms will be adjusted. There are a lot of interwoven aspects. The same discussions about parking for instance come up all the time. It takes time that simply isn’t there anymore. I am not a politician, but when the will is there, a lot is possible. You can see subsidies as a decision of the society. A town like Vienna has a lot of power to make things happen. Nobody can make the change alone, so we all have to act simultaneously.
– Richard Scheich (feld72)
I never thought that climate change would become life threatening in my lifetime. I am 47 now. Especially the heat in summer is likely to be a real threat by the time I am older. Buildings account for 40% of all CO₂ emissions. From an ecological point of view there really shouldn’t be any more new constructions unless they reduce CO₂. That implies that they are built of materials like wood that store rather than cost CO₂.
– Markus Zilker (einszueins):
Excursion key data:
Date: 05.10.2022
Location: Transsolar, Munich, Germany
Guides/Experts: Markus Krauß, Transsolar